Difference between revisions of "Report Settings"
| (16 intermediate revisions by the same user not shown) | |||
| Line 1: | Line 1: | ||
| − | |||
| − | |||
| − | |||
| − | |||
| − | |||
| − | |||
| − | |||
| − | |||
| − | |||
| − | |||
| − | |||
| − | |||
| − | |||
==Default Report Settings== | ==Default Report Settings== | ||
| − | + | You may restore default print settings from the Report Options tab or the Reporting menu. | |
| − | + | To restore default print settings from the Report Options tab: | |
| − | |||
| − | + | :1) Click the '''Reports''' icon. | |
| + | :[[file:Reports icon.png]] | ||
| − | |||
| − | + | :2) Click the '''[[Report Options]]''' tab. | |
| − | |||
| − | + | [[File:Reports Option Tab.png]] | |
| − | |||
| − | + | :3) Click the '''Restore Defaults''' button before printing to set all reports to suggested print settings. | |
| − | |||
| − | + | To restore default print settings from the Reporting menu: | |
| − | + | :1) Click on '''Reporting''' in the menu line. | |
| − | + | :2) Click '''Restore Report Options to Default Settings'''. | |
| − | |||
| − | + | ==Printing Your Graphs== | |
| + | Not all reports have associated graphs. Customizable graphs are available for the following reports: | ||
| − | + | * Workforce Analysis | |
| + | * Job Group Analysis | ||
| + | * Availability/Utilization | ||
| + | * Goals Progress | ||
| − | + | You must access the '''Options''' window for each report in order to print graphs. There are two ways to access the '''Options''' window. The first way is to click '''Reporting''' and then '''Required Reports''' then select each report individually. The second way is to click the '''Reports''' icon, click the '''Report Option''' tab, then click the '''Options''' button for each report. | |
| − | + | In each '''Options''' window, simply click the '''Graph''' button to access the '''Graph''' printing window. | |
| − | + | [[ File:Job Group Anlaysis Graph Options.png]] | |
| − | |||
| − | + | If you wish to change the number of graphs displaying on a printed page select '''Options''' from the '''Utilities''' menu and then click on the '''Graphs''' tab. | |
| − | + | [[file:Utilities-Graphs Tab 10-24-14.png]] | |
| − | + | ==Rollup Reporting== | |
| + | [[File:ProTag.jpg]] There is a visual indicator to let users know that all reports are filtered by a rollup employee. The border color for most forms will now change to dark red if the user has chosen to roll up reports based on a supervisor. | ||
| − | + | [[file:Report Options-Rollup with Name.png]] | |
| − | |||
| − | + | The border color will revert to dark grey when the rollup is cleared. If Companywide reports are chosen the border color is green. | |
| − | + | [[file:Report Options - Companywide.png]] | |
| − | + | ==See Also== | |
| − | |||
| − | |||
| − | |||
| − | |||
| − | == | ||
| − | |||
| − | |||
| − | |||
| − | |||
| − | |||
| − | |||
| − | |||
| − | |||
| − | |||
| − | |||
| − | |||
| − | |||
| − | |||
| − | |||
| − | + | [[Publish Your Reports]]<br> | |
| − | [[ | ||
| − | |||
© Copyright Yocom & McKee, Inc. | © Copyright Yocom & McKee, Inc. | ||
Latest revision as of 21:15, 24 October 2014
Default Report Settings
You may restore default print settings from the Report Options tab or the Reporting menu.
To restore default print settings from the Report Options tab:
- 2) Click the Report Options tab.
- 3) Click the Restore Defaults button before printing to set all reports to suggested print settings.
To restore default print settings from the Reporting menu:
- 1) Click on Reporting in the menu line.
- 2) Click Restore Report Options to Default Settings.
Printing Your Graphs
Not all reports have associated graphs. Customizable graphs are available for the following reports:
- Workforce Analysis
- Job Group Analysis
- Availability/Utilization
- Goals Progress
You must access the Options window for each report in order to print graphs. There are two ways to access the Options window. The first way is to click Reporting and then Required Reports then select each report individually. The second way is to click the Reports icon, click the Report Option tab, then click the Options button for each report.
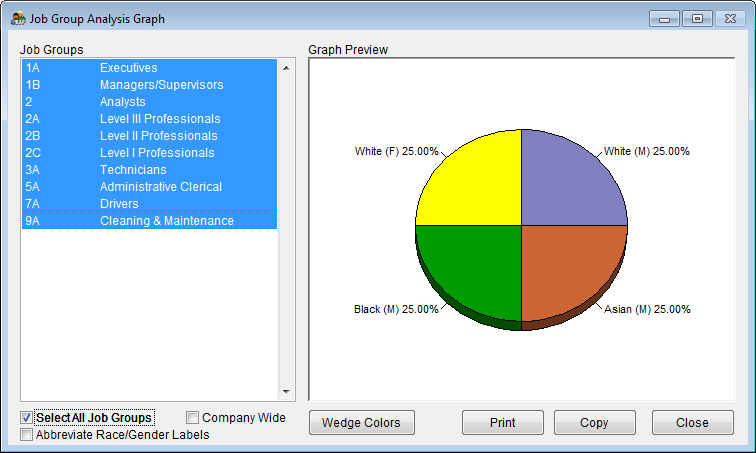
In each Options window, simply click the Graph button to access the Graph printing window.
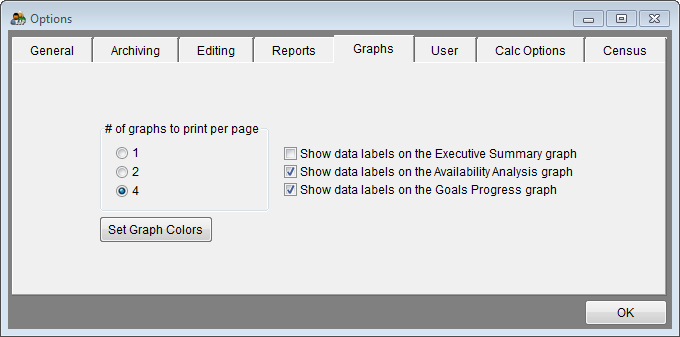
If you wish to change the number of graphs displaying on a printed page select Options from the Utilities menu and then click on the Graphs tab.
Rollup Reporting
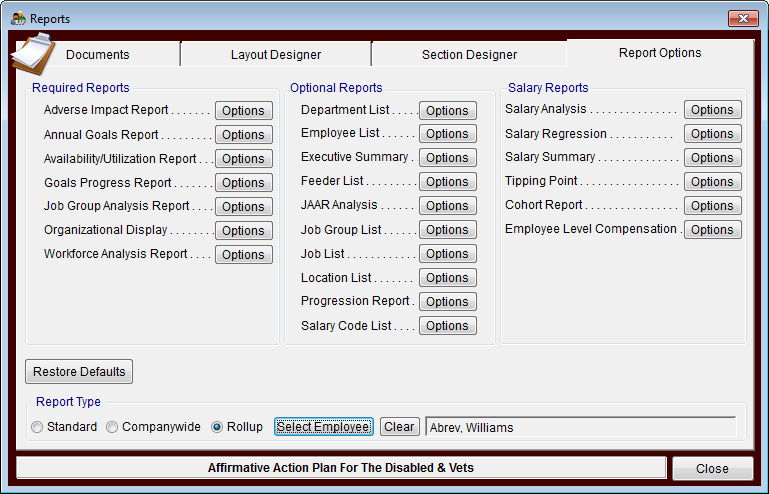
![]() There is a visual indicator to let users know that all reports are filtered by a rollup employee. The border color for most forms will now change to dark red if the user has chosen to roll up reports based on a supervisor.
There is a visual indicator to let users know that all reports are filtered by a rollup employee. The border color for most forms will now change to dark red if the user has chosen to roll up reports based on a supervisor.
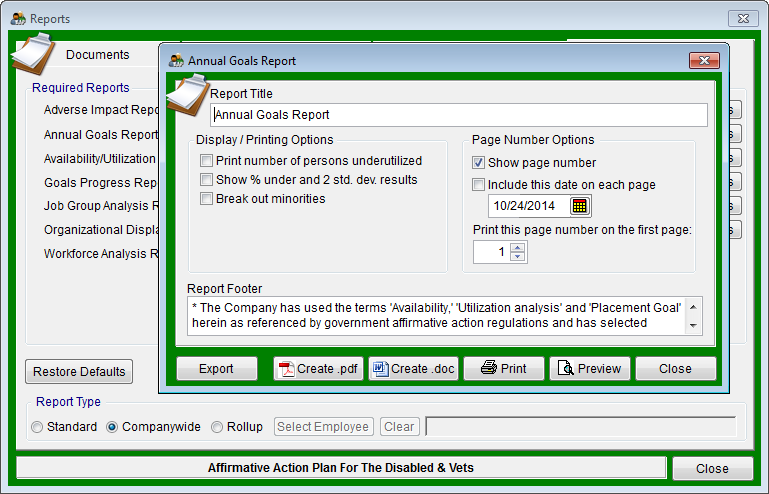
The border color will revert to dark grey when the rollup is cleared. If Companywide reports are chosen the border color is green.
See Also
© Copyright Yocom & McKee, Inc.


