Salary Regression Analysis
The Salary Regression Analysis is a Multiple Linear Regression analysis method of testing for possible compensation disparity within an organization. Unlike the Salary Analysis report, which simply compares the average or median pay of females to males, or minorities to whites, the multiple regression analysis takes into account other factors that influence salaries (e.g. seniority, performance, skills etc.) then determines if any difference in pay is statistically significant. It cannot be overemphasized that the salary regression analysis performed constitutes only the first step in what may be a necessary comprehensive study of your compensation practices. While providing useful insight to potential wage disparities, the results of this salary analysis should not be construed as conclusive evidence of either the existence of, or lack of an impermissible compensation practice.
The Salary Regression Analysis report estimates the pay for female and minority salaries based on a variety of factors, such as: number of years employed with the company, number of years in the current job, and/or performance ratings. Each organization may utilize up to six factors to help explain potential pay disparities. The analysis can be broken down by department, jobs, job groups, EEO categories, salary grades, or by all employees. We normally choose to complete the analysis by job, because this most closely follows Equal Pay Act guidelines.
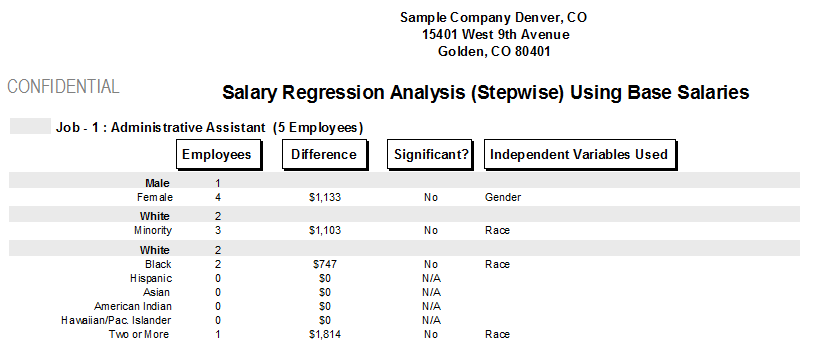
The Salary Regression Analysis report lists the job (or salary grade, department, job group, etc.) being tested, the total number of employees in the job and their average salaries. Note: employees who report to offsite managers are not included in the Salary Regression Analysis report.
The "Avg Salary" column shows the average salaries for each of the groups being tested. The "Significant" and "Std Dev" columns tell us whether race or gender has a statistically significant impact on compensation. A standard deviation of 2 or more is considered statistically significant. The last column indicates the variables used in the analysis. Adding more variables, such as performance rating, experience, and date in job, may eliminate statistically significant pay disparities.
On the reports, N/A means not applicable. In some instances you may need to remove one or more of the variables used in the test because the number of employees is too small to represent a valid test. It is also possible that there may be no employees in that particular group to perform the test.
See Also
© Copyright Yocom & McKee, Inc.
