Report Options - Salary Regression
From YMwiki
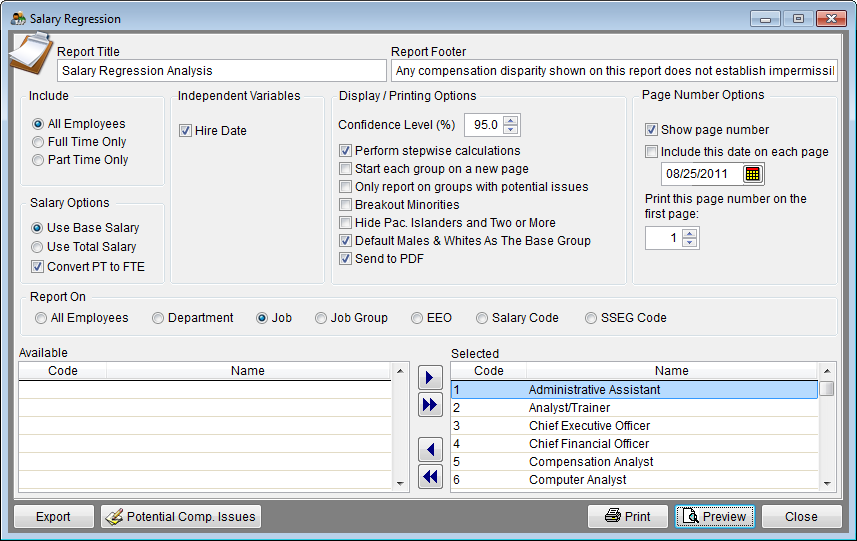
Jump to navigationJump to searchThe Salary Regression Report Options window allows the user to select the options and groups that will be used when performing the Salary Regression Report. The Salary Regression Report Options window may be accessed by clicking on the Reports icon and then clicking the the Adverse Impact Options button on the Report Options tab or by selecting Salary Regression Analysis from the Reporting, Optional Reports menu. An example of the Salary Regression Report can be found at Salary Regression Analysis.
General Options
- Report Title box
- This box contains the text used for the report title and can be edited by the user. Changes to the text will be saved for future use. Clicking on restore defaults button (on the Report Options window) will restore the original text.
- Report Footer box
- This box contains the text used for the report footer and can be edited by the user. Changes to the text will be saved for future use. Clicking on restore defaults button (on the Report Options window) will restore the original text.
- Include Options
- Permits the user the include all employees, just full-time, or just part-time employees in the analysis. Part-time employees are sometimes excluded from the analysis of full-time employees if part-time employees are paid different rates.
- Salary Options
- Permits the user to analyze base salaries or total salaries.
- Independent Variables
- Permits the user to check the box next to those variables that are to be included in the analysis.
- Report On
- Permits the user to select the type of groups that will be analyzed by clicking the radio button next to All Employees, Department, Job, Job Group, EEO, Salary Code, or SSEG Code. The user may then select groups to include in the report by clicking the >> button to move all groups from the Available list on the left to the Selected list on the right, or by clicking the > button to select specific groups. Double-clicking on a group will also move that group over to the selected list.
Display/Printing Options
- Confidence Level (%)
- This value represents the degree of statistical confidence that must exist before a pay differential is reported significant. The default value is 95% which represents approximately 2 Standard Deviations. A lower value will increase the likelihood of a statistically significant result.
- Perform Stepwise Calculations
- Checking this box causes the program to include only those independent variables that have a statistically significant impact on salaries.
- Start each group on a new page
- Forces each group that is analyzed to appear on a separate page.
- Only report on groups with potential issues
- Only groups that report a Yes in the Significance column for gender or race will be printed.
- Breakout Minorities
- Checking this box will include a list of all minorities groups and the statistics for each group.
- Hide Pac. Islanders and Two or More
- The columns for Pacific Islanders and Two or More will not be displayed on the Regression reports when this box is checked.
- Default Males & Whites As The Base Group
- Checking this box forces the software to use Males and Whites as the base group for comparison. Unchecking the box allows the software to calculate the base group.
- Send to PDF
- Checking this box sends the report to a PDF file that is stored in the plan's Support Docs folder when clicking the print button. The Support Docs folder is accessed by clicking the Pen and Folder icon on the Main screen.
- Page Number Options
- Show page number - Each page of the report will display a page number when this box is checked.
- Include this date on each page - Each page of the report will display the selected date when this box is checked.
- Print this page number on the first page - The report will display page numbers starting with the specified number when this box is checked.
Buttons
- Moves the selected item from the left side of the screen to the right side.
- Moves all items on the left side of the screen to the right side.
- Moves the selected item from the right side of the screen to the left side.
- Moves all items on the right side of the screen to the left side.
- Export
- Creates a Microsoft Excel file using the specified path and file name that contains all the data used in the Regression Analysis.
- Potential Comp Issues
- A narrative summary that explains the Salary Regression report and lists the groups with statistical significance is displayed in a widow that can be copied to the clipboard or saved to a text file.
- Permits the user to print the report to a PDF file when the Send to PDF box is checked, or to a printer.
- Preview
- Displays a report of the selected groups in a preview window.
- Close
- Closes the Salary Regression Options window.
© Copyright Yocom & McKee, Inc.
