Executive Summary
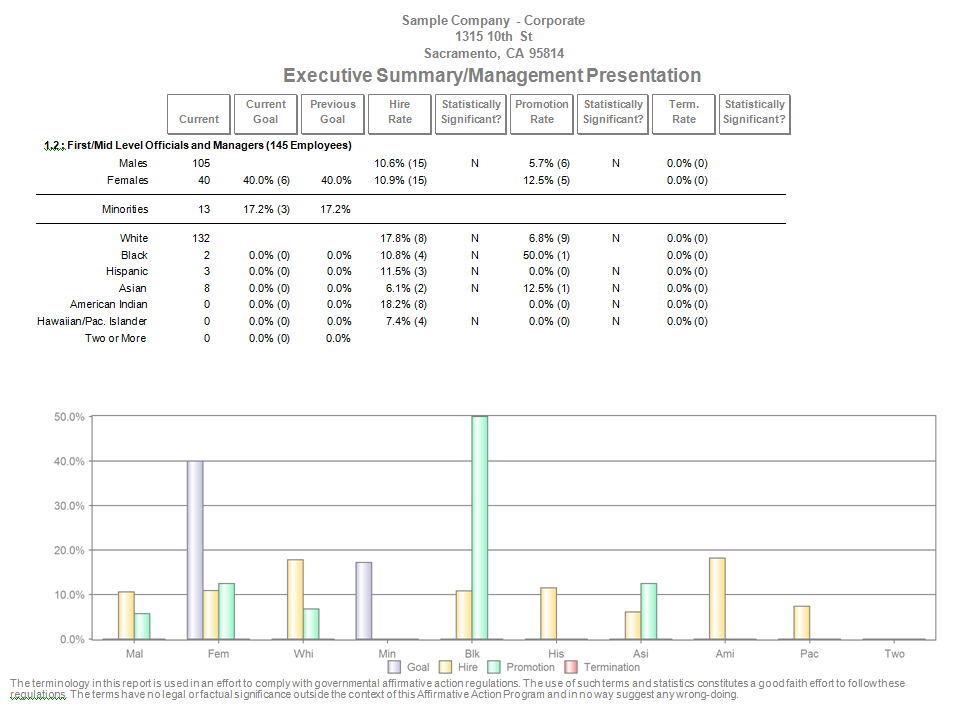
The Executive Summary/Management Presentation is intended to assist you when presenting the results of your affirmative action plan (AAP) to management. By regulation, one of your duties includes advising top management of program effectiveness and submitting recommendations to improve unsatisfactory performance. The Executive Summary/Management Presentation summarizes the results from several key reports, including Annual Goals, Goals Progress and Adverse Impact Analysis.
The Executive Summary/Management Presentation summarizes the most important information for every Job Group in your AAP. It lists the Job Group Code and Name, followed by the number of employees in parenthesis. Rows for Females and Minorities are displayed below Job Group Name. Columns from left to right are described below:
- 1. The total number persons in each of these categories are shown under the "Current" column.
- 2. "Current Goal?" displays the percentage goal set in the Annual Goals Report for females and minorities and in parenthesis, the number of additional persons needed at this time to meet that goal. Keep in mind that percentage goals are targets for placements. For example, if you show a Current Goal of 35% for Females, this means that over the next year, your goal is to have 35% of all placements into this group be female.
- 3. "Previous Goal?" displays the percentage goal set in the Goals Progress Report for females and minorities. These are the placement goals that were set in last years AAP. This column lets you easily compare current goals to last year.
- 4. "Hire Rate" shows what percent of persons who applied were hired and the number of persons hired in parenthesis, broken down by females and minorities.
- 5. The "Statistically Significant?" column alerts you to groups that are failing in the Adverse Impact Analysis report. To fail means that the unfavored group was hired at a significantly lesser rate than the favored group
- 6. "Promotion Rate" displays the percent of persons promoted out of this group and the number of persons in parenthesis, broken down by females and minorities.
- 7. The "Statistically Significant?" column alerts you to groups that are failing in the Adverse Impact Analysis report. To fail means that the unfavored group was promoted at a significantly lesser rate than the favored group.
- 8. "Term Rate" refers to the Adverse Impact Analysis of terminations. It displays the percent of persons terminated from this group and the number of persons in parenthesis, broken down by females and minorities.
- 9. The "Statistically Significant?" column alerts you to groups that are failing in the Adverse Impact Analysis report. To fail means that the unfavored group was terminated at a significantly greater rate than the favored group.
The Executive Summary/Management Presentation shows detail for each Job Group. Male numbers are shown in the row above Females, Whites are displayed in the column above Minorities, and separate minority groups are broken out in the rows below Minorities. The detailed data is graphically displayed at the bottom of the page.
See Also
Adverse Impact Reports
Understanding Your Reports
© Copyright Yocom & McKee, Inc.
