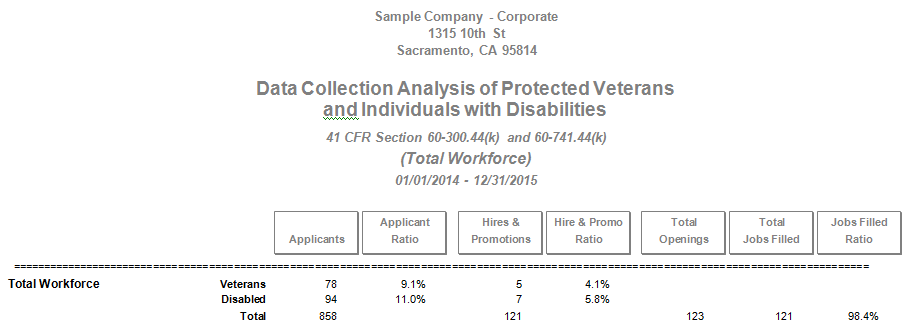
Data Collection Analysis of Protected Veterans and Individuals with Disabilities Report
The Data Collections Analysis of Protected Veterans and Individuals with Disabilities shows the total number applicants, hires and promotions to who self-identified as protected veterans or individuals with disabilities. The total line shows the number of applicants, hires and promotions to, total openings, total jobs filled and jobs filled ratio.
What does each column mean?
Applicants: The total of applicants in each category.
Applicant Ratio: Percentage of all applicants who self-identified as a veteran or individuals with disabilities.
Hires & Promotions: The total of hires and promotions to in each of the categories.
Hire & Promo Ratio: Percentage of all hires and promotions to who self-identified as a veteran or individual with a disability.
Total Openings: The total of all hires and promotions to plus the number of requisitions without a hire or promotion to attributed to them.
Total Jobs Filled: The total of all hires and promotions to.
Jobs Filled Ratio: The percentage of total openings filled.
What should you look for?
- 1. Have you entered requisition codes for all applicants if your company uses requisitions?
- 2. Have you entered requisitions codes for each hire and promotion if your company uses requisitions?
- 3. Do the report totals reflect the number of openings and hires you have in your HRIS? If not, you should research the reason for the discrepancy and manually change the totals in the software or edit the published report.
See Also
Report Options – Data Collection Analysis of Protected Veterans and Individuals with Disabilities
© Copyright Yocom & McKee, Inc.
