Report Options - Availability/Utilization Report
From YMwiki
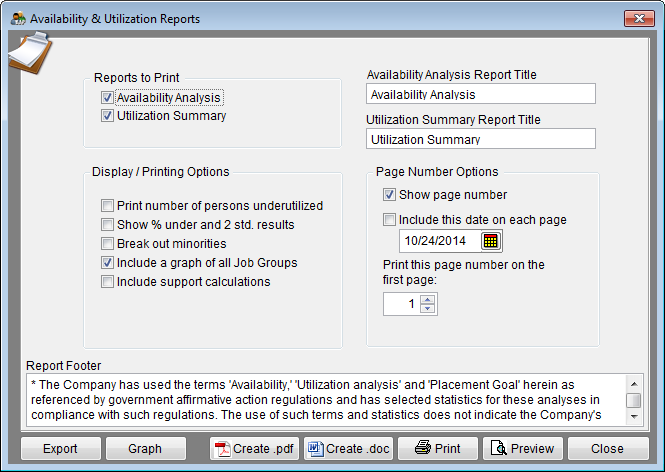
Jump to navigationJump to searchThe Availability & Utilization Report Options window allows the user to select the options and groups that will be used when creating the Availability & Utilization Reports. The Availability & Utilization Report Options window may be accessed by clicking on the Reports icon and then clicking the Availability & Utilization Reports Options button on the Report Options tab or from the Reporting menu. Click on Reporting, select Required Reports and then Availability & Utilization Report. An example of the Availability Report can be found at Availability Analysis Report.
Contents
General Options
- Report Title box
- This box contains the text used for the report title and can be edited by the user. Changes to the text will be saved for future use. Clicking on the Restore Defaults button on the Report Options tab or Restore Report Options to Default Settings on the Reporting menu will restore the original text.
- Report Footer box
- This box contains the text used for the report footer and can be edited by the user. Changes to the text will be saved for future use. Clicking on the Restore Defaults button on the Report Options tab or Restore Report Options to Default Settings on the Reporting menu will restore the original text.
Reports To Print
- Availability Analysis
- Check this to print the Availability Analysis.
- Utilization Summary
- Check this to print the Utilization Summary.
Display/Printing Options
- Print number of persons underutilized
- Checking this box causes the program to include number of underutilized individuals on the report. This may be helpful for planning purposes, but it is recommended that you not include this information in your actual affirmative action plan.
- Show % under and 2 std. dev. results
- Checking this box causes the program to show the percentage of underutilization.
- Breakout Minorities
- Checking this box will include a list of all minorities groups and the statistics for each group.
- Include a graph of all Job Groups
- Checking this box creates a set of graphs which are stored in the plan’s Support Docs folder when clicking the print button. The Support Docs folder is accessed by clicking the Pen and Folder icon on the Main screen.
- Include support calculations
- Checking this box creates a set of reports showing how availability is calculated for factors 1a and 1b for each job group which are stored in the plan’s Support Docs folder when clicking the print button. The Support Docs folder is accessed by clicking the Pen and Folder icon on the Main screen.
Page Number Options
- Show page number
- Each page of the report will display a page number when this box is checked.
- Include this date on each page
- Each page of the report will display the selected date when this box is checked.
- Print this page number on the first page
- The report will display page numbers starting with the specified number when this box is checked.
Buttons
- Export
- Creates a Microsoft Excel file using the specified path and file name that contains all the data used in the Availability and Utilization reports.
- Graph
- Graphs can be printed, previewed on screen, or copied to the Windows clipboard and inserted into word processing documents.
- Create .pdf
- Creates a .pdf file that is stored in the plan's Support Docs folder when the Create .pdf button is clicked. The Support Docs folder is accessed by clicking the Pen and Folder icon on the blue screen.
- Create .doc
- Creates a Microsoft Word file that is stored in the plan's Support Docs folder when the Create .doc button is clicked. The Support Docs folder is accessed by clicking the Pen and Folder icon on the blue screen.
- Permits the user to publish the report to a printer.
- Preview
- Displays a report of the selected groups in a preview window.
- Close
- Closes the Availability & Utilization Reports Options window.
© Copyright Yocom & McKee, Inc.
