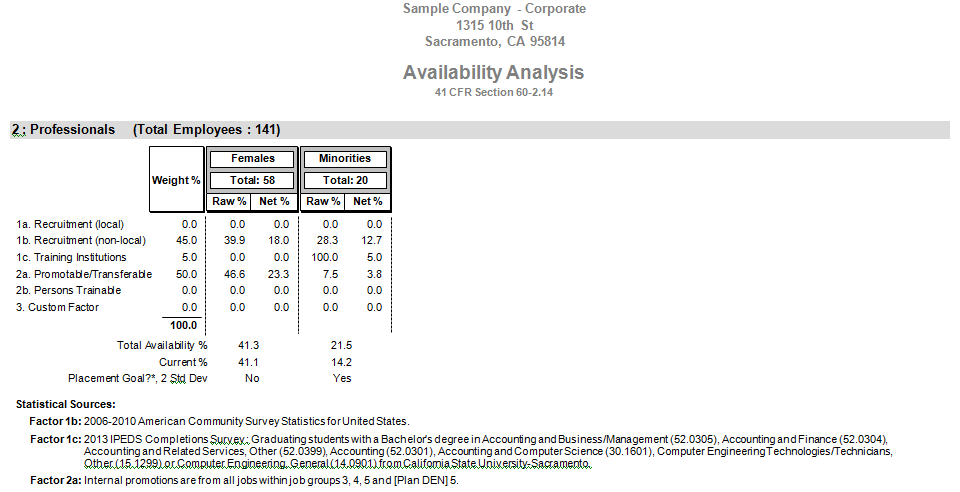
Availability Analysis Report
The Availability Analysis report analyzes your workforce by matching the current percentage of minorities and females you have in the jobs that make up each job group to the percentage of minorities and females that are available in the labor market you use to fill those jobs. The top of the report shows the name of the job group, and the total number of total employees, females, and minorities that constitute the job group. To determine minority and female availability, the OFCCP has developed two main factors that you see listed in the middle of the report.
To determine female and minority availability, these factors are:
1. The percentage of minorities or women with requisite skills in the reasonable recruitment area.
2. The percentage of minorities or women among those promotable, transferable, and trainable within the contractor's organization.
We have broken these down into the following factors:
- 1a Local census area
- 1b Non-local census area
- 1c Training institutions
- 2a Promotable/Transferable
- 2b Persons trainable
- 3 Custom Factor
Factors 1a & 1b represent those individuals in relevant labor market areas who currently have the skills and experience for the jobs in the job group.
Factor 1c is the percent of minorities and females at training institutions where your company recruits who have the educational training in areas needed by your company. These factors are more often applicable to job groups where a higher level of training or experience is required.
Factor 2a gives the percentages of females and minorities in job groups that "feed" into the job group being analyzed.
Factor 2b gives the percentage of minorities and females in your workforce who are trainable for promotion during the current plan year.
Factor 3 is a rarely used, but available custom factor of your choosing that can reflect either internal or external recruitment.
There are two columns of figures under the Minorities and Females headings. The first column, Raw Percent, gives the total percent of availability for each factor. The second column representing the Net Percent is the result of the multiplication of the percentage under the Weight Factor column times the raw percentage. The Weight Factor column is the degree of consideration you give to each factor when filling the jobs in each job group. A zero percentage is shown where no consideration is given to that factor. Adding the percentages in the Net Percent column yields the total percentage of availability for minorities and females. Listed just below this availability figure is the current percentage of minorities and females found in the job group. The total availability and the utilization are compared in a 2 Standard Deviations test to determine whether your organization is underutilized in minorities and/or females in the job group. If the current utilization percentage of females and minorities is beyond 2 standard deviations of their availability percentage, a placement goal is set; the goal is the total percent availability.
See Also
Availability Calculations
Job Group Edit
Report Options
Report Options - Availability/Utilization Report
Understanding Your Reports
© Copyright Yocom & McKee, Inc.
